pidbot user manual
pidbot user manual
Getting Started
Installing pidbot
Download the pidbot version that is compatible with the Ignition version you are using. Install the pidbot .modl on your Ignition gateway webpage, following the Ignition module installation procedure.
Components
The pidbot module includes three vision components: Tuning Dashboard, Process Simulator, and PID Simulator. After the module is installed, the components will appear in the Ignition Designer Component Pallette.
The Tuning Dashboard is the main component in the pidbot module, and is the primary focus of this manual.

PID Config
Industrial controllers use different variants of the PID algorithm. Tuning values are different depending on which PID controller is being used. In order to find the best tuning values for a particular system, the Tuning Dashboard component must be aware of the PID controller configuration. The configuration information can be setup in the component's "PID Config" section of the Vision Property Editor, in the Ignition Designer. If the "Config Editable" property is set to true, changes can also be made using the "PID Config" panel built into the Tuning Dashboard.
Installing pidbot


PID Form
The PID Form property identifies the structure of the PID equation that is used by the PID controller. The user can select between “Independent” or “Dependent.”
Independent
The Independent form of the PID equation is sometimes refererred to as “Parallel” form. When this form is selected, three separate gains are used: Proportional Gain (Kp), Integral Gain (Ki) and Derivative Gain (Kd). This component will display suggested tuning values in terms of Kp, Ki, and Kd when Independent is selected.
Dependent
The Dependent form of the PID equation uses Controller Gain (Kc), integral time (Ti), and a derivative time (Td) as tuning constants. This component will display tuning values in terms of Kc, Ti, and Td when Dependent is selected. Note: integral time is sometimes referred to as “reset time” or “reset rate.”
PID Action
PID Action specifies how the PID controller calculates error. The user can select between
“E=SP-PV” or “E=PV-SP”, where E refers to error, SP refers to Setpoint, and PV refers to Process Variable. Changing PID Action has the same effect as changing the sign (+/-) of the PID tuning values. Typically, PID controllers calculate error as SP-PV by default, and may offer the option to change to PV-SP if necessary, so that tuning values can always be positive.
Time Unit
Specifies the time units used by the PID controller for the Integral and Derivative tuning terms. The user can select between "Minutes" and "Seconds".
Time Unit for an Independent Form PID Controller
Select "Minutes" if the PID controller's time unit for Integral Gain (Ki) is in 1/minutes, and Derivative Gain (Kd) is in minutes. Select "Seconds" if the time unit for Ki is in 1/seconds, and Kd is in seconds.
Time Unit for a Dependent Form PID Controller
Select "Minutes" if the PID controller Integral Time (Ti), and Derivative Time (Td) are in minutes. Select "Seconds" if Ti, and Td are in seconds.
PID Controller Scaling
Many industrial PID controllers scale the inputs (PV & SP), before applying the PID algorithm. After the PID algorithm is applied, the output (CV) may also be scaled. They are scaled to a percent of PV range and CV range, respectively, and the tuning values are set in terms of percent.
This hidden PID scaling is the reason why someone might say a Proportional Gain of 1000, for instance, is "very high" without knowing anything about the process being controlled. Due to scaling, they expect it to be somewhere closer to 1.
The Tuning Dashboard component includes scaling terms to work with scaled PID controllers. PID scaling scenarios are listed below, with configuration instructions.
Case 1: Controller does not scale to percent (Tuning values are in Engineering Units)
For PID controllers that do not scale to a percentage, the pidbot scaling terms can be left at their default values (below). Any PV range which is equal to CV range will effectively prevent tuning value scaling.
-
PV Scale High = 100
-
PV Scale Low = 0
-
CV Scale High = 100
-
CV Scale Low = 0
Case 2: Controller scales to percent, and the PV and CV values connected to pidbot are in Engineering Units
For PID controllers that scale to a percent, the tuning values are in terms of percent (proportional gain units are %CV/%PV). The Tuning Dashboard needs to use the scale ranges to generate appropriate tuning values.
-
PV Scale High = The value that corresponds to 100% of PV scale range.
-
PV Scale Low = The value that corresponds to 0% of PV scale range.
-
CV Scale High = The value that corresponds to 100% of CV scale range.
-
CV Scale Low = The value that corresponds to 0% of CV scale range.
Case 3 (Mixed): Controller scales to percent, but the PV and/or CV values connected to pidbot are already in percent
Some PID controllers make both scaled and unscaled CV and PV tags available. The tuning values are in percent, similar to Case 2. However, if the tuning dashboard is connected to PV% and CV%, tuning values will already be calculated on a percent basis. In this case, the scale range values in the PID controller should not be applied. To summarize:
-
If PV is in %, use the PV scale values from Case 1, else, use the values from Case 2.
-
If CV is in %, use the CV scale values from Case 1, else, use the values from Case 2.
We know that PID scaling can be confusing. To request an example for a particular PID controller brand, contact JLB Controls for support!
PID Config Examples
The table below can be used to help map properties of a particular PID controller brand to pidbot properties. Some controllers are listed multiple times, because they expose multiple PV/CV tags which are scaled differently, so scaling values used by pidbot change accordingly. JLB Controls wants to ensure your pidbot application is working great, please contact us with any questions.
Name |
|---|
pidbot |
Studio5000 PIDE (.CV) |
Studio5000 PIDE (.CVEU) |
PlantPAx P_PIDE |
Studio5000 PID (Process Variable & Control Variable) |
Studio5000 PID (.PV & Control Variable) |
Studio5000 PID (.PV & .OUT/.SO) |
Productivity Suite PID (.Output) |
Productivity Suite PID (.ProcOutPcnt) |
PV | CV | PV Scale High | PV Scale Low | CV Scale High | CV Scale Low | P | I | D | PID Form | PID Action | Time Unit |
|---|---|---|---|---|---|---|---|---|---|---|---|
.pv | .cv | .pvScaleHigh | .pvScaleLow | .cvScaleHigh | .cvScaleLow | .currentP | .currentI | .currentD | .pidForm Independent: 0 Dependent: 1 | .pidAction E=SP-PV: 0 E=PV-SP: 1 | .timeUnit Seconds: 3 Minutes: 4 |
.PV | .CV | .PVEUMax | .PVEUMin | 100 | 0 | .PGain | .IGain | .DGain | .DependIndepend Independent: False Dependent: True | .ControlAction E=SP-PV: False E=PV-SP: True | N/A Always Minutes |
.PV | .CVEU | .PVEUMax | .PVEUMin | .CVEUMax | .CVEUMin | .PGain | .IGain | .DGain | .DependIndepend Independent: False Dependent: True | .ControlAction E=SP-PV: False E=PV-SP: True | N/A Always Minutes |
.Val_PV | .Val_CV | .Cfg_PVEUMax | .Cfg_PVEUMin | .Cfg_CVEUMax | .Cfg_CVEUMin | .Cfg_PGain | .Cfg_IGain | .Cfg_DGain | .Cfg_Depend Independent: False Dependent: True | .Cfg_CtrlAction E=SP-PV: False E=PV-SP: True | N/A Always Minutes |
Process Variable | Control Variable | .MAXI | .MINI | .MAXCV | .MINCV | .KP | .KI | .KD | .PE Independent: 0 Dependent: 1 | .CA E=SP-PV: 0 E=PV-SP: 1 | N/A Seconds if .PE=0 Minutes if .PE=1 |
.PV | Control Variable | .MAXS | .MINS | .MAXCV | .MINCV | .KP | .KI | .KD | .PE Independent: 0 Dependent: 1 | .CA E=SP-PV: 0 E=PV-SP: 1 | N/A Seconds if .PE=0 Minutes if .PE=1 |
.PV | .OUT or .SO | .MAXS | .MINS | 100 | 0 | .KP | .KI | .KD | .PE Independent: 0 Dependent: 1 | .CA E=SP-PV: 0 E=PV-SP: 1 | N/A Seconds if .PE=0 Minutes if .PE=1 |
.ProcessVar | .Output | .InputRangeMax | .InputRangeMin | .OutRangeMax | .OutRangeMin | .Gain | .Reset (Note 1) | .Rate | N/A Always Dependent | Process Action E=SP-PV: "Forward" E=PV-SP: "Reverse" | Unlabeled Min/Sec for I (Note 2) Always Sec for D |
.ProcessVar | .ProcOutPcnt | .InputRangeMax | .InputRangeMin | 100 | 0 | .Gain | .Reset (Note 1) | .Rate | N/A Always Dependent | Process Action E=SP-PV: "Forward" E=PV-SP: "Reverse" | Unlabeled Min/Sec for I (Note 2) Always Sec for D |
Note 1: For this PID controller, setting the integral term to zero maximizes integral effects, whereas pidbot disables integral when it is set to zero. Ignition scripting, or derived tag can be used to translate. If accepting values in the Tuning Dashboard, and I=0, set the PID Controller integral tuning value to a very large number.
Note 2: This PID controller allows different time units to be used for the integral and derivative terms. This is not supported by pidbot. Configure the controller with matching units, or convert before binding to the pidbot component.
PID Config Example Video - PlantPAx P_PIDE
PID Config video in the Ignition Designer, using the PID controller from Rockwell Automation's PlantPAx® library.
Tuning Dashboard Setup for PlantPAx P_PIDE
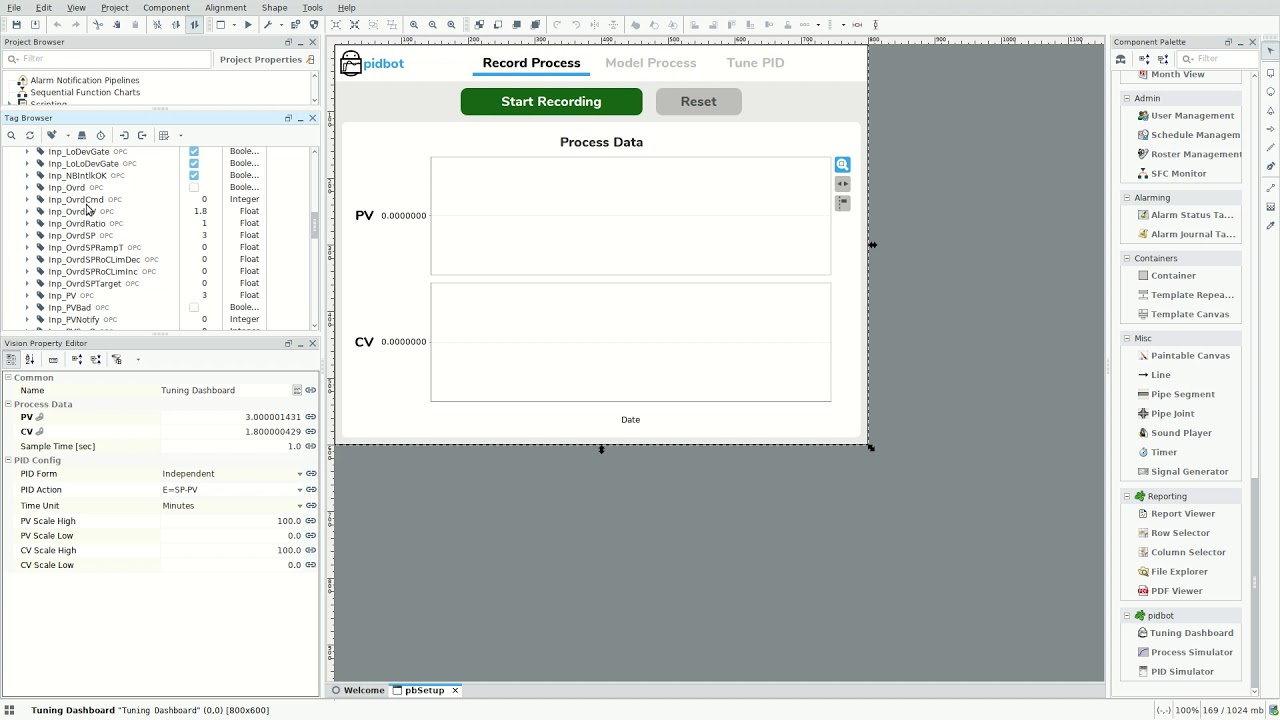
Process Data
The pidbot Tuning Dashboard analyzes PV and CV time series data to create a mathematical model of your process. The process model is used during PID tuning and simulation. Data can be collected using the built-in recording function, imported from a csv file, or bound to another data source in Ignition.

Built-in Recording Function
The Tuning Dashboard can be used to capture time series data from PV and CV tags. To use this functionality, bind the PV tag to the PV property of the component, and likewise for CV. When the "Recording" property is set to true, the component will start recording the values once every time period, which is configurable using the "Sample Time" property. The sampled PV and CV values are appended to the "PV Data" and "CV Data" dataset properties, along with timestamps. The "Recording" property can also be toggled using the "Start Recording" button on the Tuning Dashboard interface. The datasets can be cleared directly, or using the "Reset" button on the interface.
CSV Import/Export

"Import CSV" and "Export CSV" buttons appear on the Tuning Dashboard interface when the "Show CSV Buttons" property is set to true. The export function takes the PV and CV datasets, and combines them into a single csv file, for convenient storage. The exported timestamps in the csv retain millisecond precision, so it is preferable to use this method over the Ignition built-in system.dataset.toCSV() function for fast acting processes. To import data, use the Import CSV button, and select the previously exported csv file.
Other Data Sources
To use another data source, bind or write to the "PV Data" and "CV Data" properties of the Tuning Dashboard component. Ensure the first column (column 0) type is Date or a Number representing milliseconds since epoch, which will be converted to a Date by the component. The second column (column 1) must be a Number type, and will be converted to a double by the component. The timestamp column must be in chronological order, with duplicate timestamps allowed but not recommended. Any row that contains a null value (no value provided) is automatically discarded.


Data Limit
The "Data Limit" property is the maximum number of rows in the PV and CV datasets. When this limit is reached, the oldest row is removed when a new row is added. This prevents the datasets from growing too large if the component is left recording.
Generating Good Data
The previous section details procedures and settings for bringing process data into the pidbot Tuning Dashboard component. This section discusses data characteristics that are important when fitting a process model for PID tuning. Good process data can be generated using a simple procedure:
-
Minimize disturbances by putting them in manual.
-
Put the process in manual, near it's normal operating level.
-
Allow the process to reach steady state, or steady slope for an IPDT process.
-
Record data using an appropriate sample time, capturing some steady state data.
-
Bump the process, and record the response
PV & CV Tags
Process data should be gathered from the PID controller's "perspective". There may be multiple versions of PV and CV tags available in the control system. They may differ slightly from the PID controllers values due to filters, scaling, different PLC program scan times, etc. The PV and CV tags that are recorded should be the PID controller's values, or as similar as possible.
Disturbances
The pidbot module uses real process data to fit a process model. The model characterizes how the PV responds to changes in CV over time. Unfortunately, real process data is not perfect, and the PV may be impacted by factors other than CV. "Disturbances" are changes in variables (other than CV) that impact the PV. When generating process data for modeling, disturbances should be minimized whenever possible, so the PV response is predominantly driven by the CV. Commonly, disturbances arise from other processes that interact with the subject process. The best way to minimize a disturbance from another process is to put it in manual. It should be manually set near its normal operating level, so it does not cause abnormal behavior in the subject process.
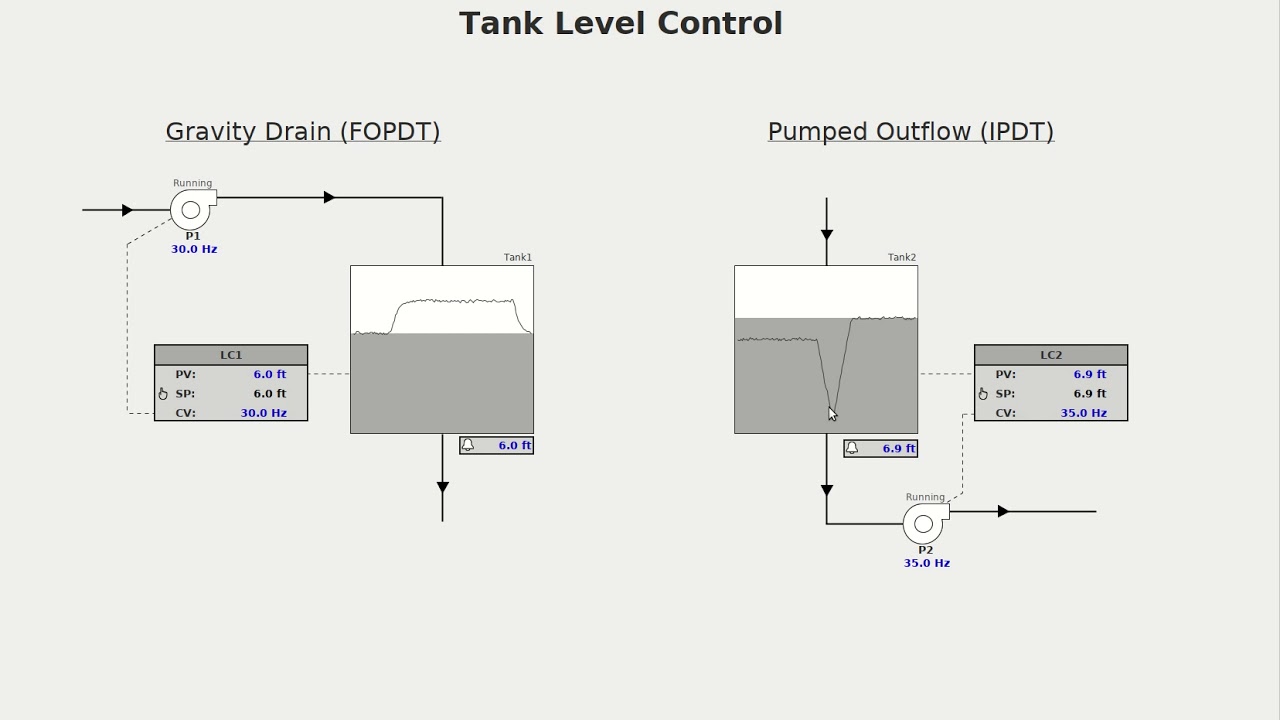
Normal Operating Level
Processes may behave differently depending on what level they are operating at. These processes are usually described as "nonlinear". Since no process is perfectly linear, data should be recorded around the process's normal operating level. This leads to a model that is a better representation of normal operation, and PID tuning that is optimized for normal operation.
Example: A tank level (PV) is typically controlled around 6ft, and the level control valve output (CV) operates around 30%. Data generated while stepping the valve from 15%-40%, with level changing between 5.2ft - 7ft, is probably a good representation of normal operating level.
Highly nonlinear process control applications may benefit from different PID tuning values at different operating levels. This strategy is commonly referred to as "gain scheduling". In this case, the Tuning Dashboard can be used to create multiple process models from data generated at different operating levels. Tuning for each model is performed as usual. Logic can be implemented (in the PLC or other control device) to interpolate or change between tuning values based on operating level.
Steady State / Steady Slope
The process must be "steady" before performing a bump test. We define "steady" differently depending of the type of process that we are modeling. For more information the types of process models used by pidbot, see the Model Types section.
FOPDT Process Steady State
An FOPDT process will eventually reach steady state when its CV is held constant. Steady state occurs when CV and PV remain constant over time.
IPDT Process Steady Slope
An IPDT process will eventually reach a steady slope when its CV is held constant. Steady slope occurs when CV remains constant over time, and the rate of change in PV remains constant over time.
Real process data is never perfect, so the word "constant" is used loosely. The important point is that changes are very small compared to the ensuing bump test.
Sample Time
Process data resolution must be good enough to capture the details required for modeling. The sample time required depends on the type of process. For more information the types of process models used by pidbot, see the Model Types section.
FOPDT Process Sample Time
As a rule of thumb, sample time for an FOPDT process should be less than 1/8 of the process time constant.
IPDT Process Sample Time
As a rule of thumb, sample time for an IPDT process should be less than 1/2 of the process dead time.
Higher resolutions are preferred if possible. Ensure that the the PV and CV tags are being executed (polled) in Ignition at least as quickly as the sample time setting on the Tuning Dashboard. If data from the Ignition historian is being used, ensure that it has not been overly compressed.
Note: The Tuning Dashboard process modeler accommodates different data sources, and unevenly spaced data. It does not check data resolution and will attempt to fit a model to the data that is provided. The user must ensure the data is adequate to produce a useful process model.
Bump Test
Sharply changing the CV of a process to observe the dynamic response in PV is referred to as a "bump test". The PV response must be driven mainly by the CV change, dominating other factors, such as disturbances or noise. As a rule of thumb, the magnitude of the PV response (change in PV), should be at least 4x greater than PV variation due to noise or disturbances. The model estimate can be improved averaging multiple bump tests.
Many forms of bump testing can be used with the Tuning Dashboard component. Two well-known types are shown below. The first is the simplest, called a "step test". It is recommended to use at least two step tests, capturing data in both directions, in case the process behaves differently. The second bump test is referred to as a "doublet". Doublets are convenient because they start and finish at the normal operating level, capturing data above and below, and in both directions.


Process Model
The pidbot module uses two process model types: First Order Plus Dead Time (FOPDT), and Integrating Plus Dead Time (IPDT). The vast majority of process industry applications can be approximated by one of these models for the purpose of PID tuning. Model type may be configured in the Ignition Vision Property Editor, or using the FOPDT/IPDT toggle button on the Tuning Dashboard interface.

First Order Plus Dead Time (FOPDT)
Use an FOPDT model for processes that will settle to a constant PV (steady state) when CV is held constant. The FOPDT process model has three key parameters:
Gain = PV Change / CV Change
Dead Time = Time delay before PV begins to repond to a CV change
Time Constant = Time for PV to travel 63.2% of its total change

Integrating Plus Dead Time (IPDT)
Use an IPDT model for processes that will settle to a constant rate of PV change (steady slope) when CV is held constant. The IPDT process model has two key parameters. We define IPDT gain differently vs. FOPDT gain, but the definition of dead time is the same.
Gain = PV Slope Change / CV Change
Dead Time = Time delay before PV begins to repond to a CV change

Dead Time
Process dead time has a large impact on PID tuning, control performance and stability. For example, a process with zero dead time could be controlled to track SP changes instantly. However, dead time is never truly zero, and should not be neglected in the process model.
Dead Time Sources
Dead time is always greater than the scan time, or code execution time, of the digital device that is running the PID controller. When fitting a model, dead time should be greater than the sample time of the process data, due to modeling uncertainty. Larger sources of dead time include transport delays, mixing delays, and cycle times for online analyzers. Additionally, the process's dominant time constant may be in series with shorter lags, such as sensor/signal filters, or valve positioning lags, which contribute to the dead time estimate.
Minimum Dead Time Property
When dead time is very small, it can easily be "lost in the noise" when modeling. The Tuning Dashboard component includes a Minimum Dead Time property to prevent underestimation of small dead times. When this property is set to -1, the dashboard component will use average sample time (time between CV and PV data points) as a minimum dead time. This can be overridden by entering a positive value, which will be used as the minimum.
There are two cases where it may be useful to enter a value into the minimum dead time property:
Case 1: There is a known dead time source greater than sample time.
For instance, if PV and CV data is sampled every 0.2 seconds, but the sensor that measures PV only updates every 0.5 seconds, enter 0.5 seconds for minimum dead time.
Case 2: Uneven data sampling (Advanced Users)
It is usually not recommended to use data that is unevenly spaced, or only logged on change, because important details may be lost. For instance, if data is only logged on change, a step change in a variable may appear as a ramp change, and would not be suitable for modeling. However, it is possible to use certain unevenly spaced data as long as the details have not been too degraded. In this case, it may be necessary to enter a value into the Minimum Dead Time property, so average sample time is not used as the lower limit.
Process Model Selection (FOPDT vs IPDT)
FOPDT vs IPDT Process Model
Modeling
After data has been collected, the next step is to fit a model to the data. The second tab of the Tuning Dashboard component is used for modeling. The modeling procedure follows. Click the links in each step for more details.
-
Select the appropriate process model type.
-
Use the Range Selector to highlight the desired model data range.
-
Click the "Model Selected Range" button to fit a process model.
-
Check the model results. Delete or adjust inaccurate models.
Range Selector
Enable the Range Selector on the "Model Process" tab by clicking the top button near the upper right corner of the chart. When enabled, the button will appear blue, see the image below. After it is enabled, click and drag across the chart to highlight the desired range of data to model.
Model Data Range
Bump test data must be available for this step, generated using the best practices discussed in the Generating Good Data section. Select the bump test data, choosing appropriate start and end points, depending on the model type.
FOPDT Data Range
-
Start Point: Select a start point when the process is at steady state. If possible, select an initial steady period of at least one dead time, before the initial CV bump.

IPDT Data Range
-
Start Point: Select a start point when the process is at steady slope. The initial steady period should be greater than one dead time before the CV bump.
-
End Point: Select a end point when the process is at steady slope. The ending steady period should be greater than one dead time after the last CV bump.

Disturbances
Avoid using data which is impacted by a sharp disturbance. If a slow disturbance cannot be eliminated, break the data into individual step responses. This will reduce modeling error caused by the accumulated effect of the disturbance. In the model screenshots below, there is a slow ramping disturbance. Modeling two separate steps yields a much better fit.


Model Results
When a process model is fit, a new row is added to the model table. The new model is used to simulate PV data, which is overlaid on the recorded PV data. Compare the simulated PV data with the actual data to check if the new model is a good fit. Inaccurate models should be deleted or adjusted, so they do not impact the average model parameters, which are used during PID tuning.
Selecting Models
Click on a row in the Model Table to select a model. When the model is selected, the row will appear highlighted. The simulated PV data associated with the model will also appear highlighted on the chart.
Deleting Models
Click the trash can button to the right of the model table to delete currently selected models.
Adjusting Models
To change a model parameter, double click on the parameter value in the model table, and enter a new value. The simulation and average parameters will update automatically when the value is changed.
Tuning
Before proceeding with PID tuning, ensure previous steps are complete:
-
Generate a process model from actual process data.
-
Setup the PID Config to match the actual PID controller being tuned.
The Tuning Dashboard component combines the process model and PID configuration to create a PID control loop simulation. The simulation and tuning can be adjusted using a variety of tools on the "Tune PID" tab. A simulation plot is updated instantly when changes are made to the system, providing valuable insight for PID optimization.
Tuning Values
The "Tuning Values" panel contains "New" tuning values, and optionally "Current" tuning values.

New
The "New" tuning values are candidate values being considered for use in the PID controller. On the PID Control Simulation plot, the blue line is the PV response associated with the new values, and the orange line is the associated CV. The "New" values are automatically updated with suggested values whenever the process model, PID Config, or Autotune Settings change, see the Autotune Settings section for more details. The "New" values can also be modified directly by entering values into the fields on the "Tuning Values" panel.
Current
The "Current" tuning values are existing values in the actual PID controller. It is not mandatory to include the current values, but it is highly recommended. If the current values are usable, then they can serve as a sanity check. If the current value simulation is very different from observed behavior, that can indicate the model is not accurate.
To include current PID tuning values, ensure the "Show Current Tuning" property is set to true. Bind the P, I, and D properties to tags containing the current Proportional, Integral, and Derivative tuning values.

Accepting the New Values
The "Current" tuning values cannot be edited directly using the fields on the "Tuning Values" panel. They can only be changed using the "Accept" button, which copies the "New" values to the "Current" values.
To enable this function, ensure "Show Current Tuning" is set to true, and the P, I, and D properties are bidirectionally bound to the current PID tuning values. Set the "Show Accept Button" property to true, and the "Accept" button will appear on the screen.
When the "Accept" button is clicked, a caution message will pop up, reminding the user that modifying PID values can be risky. This message cannot be disabled. If the user clicks "OK" on the caution message box, the Current values are set equal to the New values.
Autotune Settings
The Tuning Dashboard component automatically suggests PID tuning values, based on the process model and PID Config. Whenever the process model or PID Config is updated, the "New" tuning values are updated with suggested values. The suggested tuning value calculation can be adjusted using the "Autotune Settings" panel.
Note: The suggested tuning values can be manually overridden by entering values directly into the "New" fields on the "Tuning Values" panel.

Type
It is often useful to exclude some terms of a PID controller. Terms included in the suggested tuning values can be changed by toggling between the P, PI, and PID buttons. PI control is the most common configuration in process industries. The derivative term is commonly avoided, because it can cause excessive CV changes and amplify noise, increasing wear and tear on equipment. Occasionally, the integral term is excluded, especially where fast settling time is important and offset is not a concern, such the inner loop of a cascade.
Speed
The suggested tuning values can be made more or less aggressive using the "Speed" slider. Optimal response speed is process specific, and is typically a compromise between:
-
Improved disturbance rejection, and quicker setpoint tracking, vs.
-
Improved stability/robustness, and gentler/reduced control effort.
Sim Options
The "Sim Options" panel includes tools to modify the PID control simulation. Sim Option changes only impact the simulation (displayed on the Simulation Chart), they do not cause any tuning value changes. The Sim Options are shown below in their default configuration, with "Setpoint Change" selected, and all sliders in the center position (default slider numeric values depend on the process). The options can be reset to default by clicking the "Reset Sim Options" button.

Sim Type
There are two types of simulations available: Setpoint Change, and Disturbance. The Setpoint Change option simulates a PID controlled response to a step change in Setpoint from 0 to 1. The Disturbance option simulates a PID controlled response to a disturbance. The impact of the disturbance is equivalent to a CV step change of 1. The direction of the step is chosen so the PV response is in the positive direction. The simulation is linear, so there is no need to simulate different step sizes, all variables would simply scale by the same amount, and the time scale would remain the same.


PID Scan Time
Scan time is the elapsed time between PID algorithm updates, when the PID controller receives a new PV value, calculates a new CV, and the CV signal output to the process is updated. The CV signal is held constant until the next scan. Scan time can have a big impact on control loop performance and stability. Simulated scan time can be adjusted using the PID Scan Time slider.
Process Model Adjustments
Actual process dynamics differ from the process model for a variety of reasons, including variable plant conditions, process drift, inaccurate model fitting, and nonlinearity or other structural differences between the plant and model. The PID controller needs to tolerate some degree of plant variability, and still perform adequately. This concept is called "robustness". Adjusting the simulated process model can provide insight into the robustness of the PID controller.
The simulated process model can be adjusted using the model parameter sliders. The default values (slider center values) are the average model parameters from the "Model Process" tab.
Trial Mode
The pidbot module may be downloaded for free, and used without a license in two hour free trial mode. The trial can be reset on the Ignition gateway webpage, with the same trial reset button used by the rest of Ignition. When the pidbot module's two hour trial expires, it does not impact the rest of your Ignition modules, they will continue to operate as normal.
Tuning Dashboard Trial Windows
There are two trial windows that appear on the Tuning Dashboard component, a "Trial Mode" window, and a "Trial Expired" window. These windows only appear if the pidbot module is in trial mode - they will not appear if the module is licensed.
JLB Controls included these windows because pidbot is commonly used by automation professionals, who are capable of using/resetting trial mode, and may not need to purchase a license. With that in mind, the trial windows were added to bolster pidbot's business case through increased brand awareness, and advertising the wide range of automation solutions provided by JLB Controls. If you enjoy using pidbot, please remember to call JLB Controls for your other automation needs!
Trial Mode Window
The Trial Mode window appears on the Tuning Dashboard periodically during the two hour trial period. This window is on a ~20 second timer. If you stare at the JLB Controls logo without clicking to another tab, the window will disappear. There is a five dot ellipsis at the bottom of the screen that shows timer progress.

Trial Expired Window
The Trial Expired window appears on the Tuning Dashboard when the two hour trial period expires, until the trial is reset via the Ignition gateway webpage.

Resetting the Trial
When the two hour trial expires, go to the Ignition gateway webpage. You will find an orange or green trial banner on the webpage (depending on whether the core modules of your Ignition software are licensed - see examples below). Simply click "Reset Trial" to restart your two hour trial period.


Scripting
onAccept() Extension Function
The onAccept function is called when the user clicks the "Accept" button on the Tuning Dashboard Component. The function is called before the current tuning values are updated, giving you the opportunity to cancel the tuning value update using scripting. It is also a convenient time to log information about the tuning session, such as the user who is tuning, process model values, etc.
Java Methods (supported for pidbot v1.x.1 or greater)
New in Version 1.9.1/1.10.1 - The Tuning Dashboard Component has a number of Java methods that can be used in Ignition component scripting. See the Tuning Dashboard Javadoc for for a list of functions.
Example
# In this example, when new tuning values are accepted, the average process model parameters are read from the dashboard component, and written to tags to trend historical modeling data.
def onAccept(self):
"""
Provides a scripting opportunity when the user accepts tuning values,
before the existing PID values are updated. Return False to prevent
current tuning from updating.
Arguments:
self: A reference to the component that is invoking this function.
"""
# Read the average process values from the Tuning Dashboard Component
gain = self.getProcessGain()
deadTime = self.getProcessDeadTime()
timeConst = self.getProcessTimeConst()
# Create a list of the parameter values for writing to tags
avgProcessParams = [gain, deadTime, timeConst]
# List of Gateway tag paths for the parameters. They should have history enabled.
tagPaths = ["[default]LC1/gain","[default]LC1/deadTime","[default]LC1/timeConst"]
# Write the parameter values to the tags
system.tag.writeAsync(tagPaths,avgProcessParams)